Profiling LibGDX scene2d rendering
This is a continuation of the LibGDX performance guide, providing a deep dive into one of the many aspects — texture swaps affecting rendering latency— with an example of a live debugging session conducted here.
TL;DR
- Overload the draw() function of components to know through the profiler which individual elements are taking time to render
- Profile Texture Swapping with the profiler
- Batch calls to the same texture together — here, all child elements of Table are non-overlapping, so we can reorder their rendering arbitrarily
- Copy common images between Textures to minimize swaps
Background and definitions
A Texture is a large image that is bound for OpenGL to be able to render parts of it. It is usually up to 2048x2048 or 4096x4096, depending on the target’s availability — see here for more details.
Textures can contain many images, and you can decide to draw only part of them using a TextureRegion, which can be wrapped in a scene2d Image for placement on the stage. The mapping of where each origin file is in the large Texture is done with a TextureAtlas. Atlas files can be created with Texture Packer.
SpriteBatch is what batches rendering calls to OpenGL when rendering the same texture, storing the information in-memory to minimize calls to the OpenGL (and thus the GPU) which are expensive. Default batch size is 1000, meaning for every 1000 Image draw() functions on the same Texture there will be only one render().
However, if the SpriteBatch sees that you’re using a different Texture, it needs to bind the new Texture to OpenGL, thus forcing a render() for the current Texture. In practice, if you have Texture swaps, most of the rendering time will be due to them.
Impetus
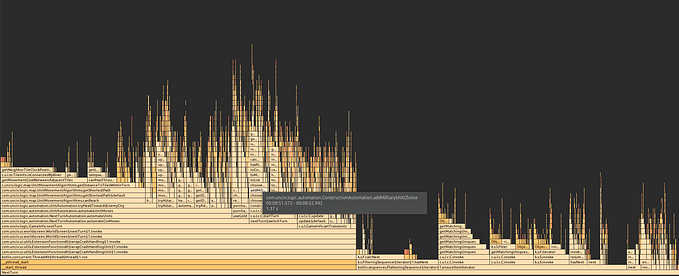
One of our devs noticed that a certain screen was feeling laggy, and profiled the behaviour in the Android profiler. This is the image sent:
What we see here is Image.draw -> SpriteBatch.flush -> Mesh.render takes the majority of the time, which indicates that flushes are happening too often as a result of Texture swaps.
Step 1 — Overload draw() for Profiling
The first problem is we can’t know from the call stack which component is rendering. As can be see above, all the draw() calls are defined in standard LibGDX classes — so we can’t tell which of our components is actually rendering. To start tackling the problem we need to disambiguate the draw() calls.
We do this by overriding the draw function in elements we’re rendering.
// Already a class - super simple
class PortraitBuilding(name: String, size: Float) : Portrait(Type.Building, name, size) {
    override fun getDefaultImageTint(): Color = Color.BLACK
    override fun draw(batch: Batch?, parentAlpha: Float) = super.draw(batch, parentAlpha)
}

// Not already a class - create an on-the-fly class for this purpose
private val techTable = object : Table(){
    override fun draw(batch: Batch?, parentAlpha: Float) = super.draw(batch, parentAlpha)
}Step 2 — Debug the individual components
Once you’ve found the culprits, you now need to look at the code to see what the order is. By default items added to Group / Table are rendered in the order they are added, but you can change this by calling Actor.setZIndex()or better, Actor.toFront() and Actor.toBack().
With your new draw() overloads, you can stick a breakpoint there and when it hits stick another breakpoint at the SpriteBatch texture comparison line — or even at the switchTexture line — to see what textures are being swapped.
Since we de-anonymized the draw() calls, we can use the stack trace of the debugger to directly jump to the draw() call that is causing this swap.
In our case, this is the large component that’s rendering slowly:
And within it, we see that a large amount of time is taken for the inner icons. That’s because we take the icon image, and add around that a circle image — which is from a different Texture.
Looking at the entire component, which is a Table, we’ll see we have a lot of swaps per component:
- Skin for the large, yellow Table background
- Circle for tech icon
- Tech icon
- Text
- Skin for inner, brown Table background
That’s 5 swaps per button even before we start the icons!
So the quick wins here is to have the icons and circles render from the same Texture (-1 for each), and get the inner table to render immediately after the large table for another -1 swaps. The latter is extremely simple — add a .toBack call on the inner table to get it to render first out of the Table children. The former needs more explaining :)
Image copies in different Textures
Our code takes an image and “wraps” it in a circle by creating a new Group with the circle rendered first and then the image. This circle is a common image, so it appears in the main texture, while the icon are from a different Texture — for now.
To eliminate this kind of Texture swap we can:
- Copy the common image into the Texture of the image it’s paired with
- Use the Texture-specific TextureRegion instead of the generic one
And we’re done!
The final result is we decreased the rendering time for this component by a minimum of 2 swaps and one for each icon, and one each time adjacent icons are from the same Texture to begin with. We already sort the icons by type, so this too is maximized.
This cuts the rendering time of this component, and thus the screen, by around half!
The final commit is here for your perusal